Pendulum with Direction Field
Physics-based simulation of a pendulum, showing both the pendulum bob movement and the direction field (or slope field) associated with the differential equation.
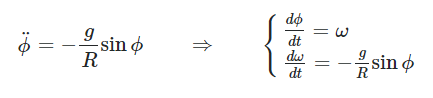
However, a fairly standard way to investigate the behavior of a 1-D particle (albeit not one taught in Taylor until much later) is to rewrite the equations of motion as follows:
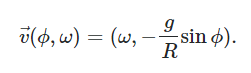
You can then plot a vector field with ϕ along the horizontal axis and ω along the vertical axis, where the vector field is
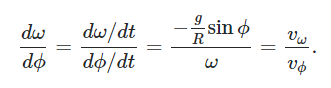
The advantage of this way of plotting things is that the slope of a vector in this plane is equal to the rate of change of ω with respect to ϕ, since by definition
How to understand ?
- The simulation is made using p5.js ( Processing using JavaScript )
- It shows the simulation of Pendulum Bob based on the direction field associated with the differential equation calculations.
- The direction field is distributed on the left side and the bob movement is showcased on the right side.
- When you click anywhere on the director field area, the movement of bob decides on the basis of direction vector represented there.
- Note : The vector field you're plotting isn't all that meaningful and accurate. This whole technique is what's known as a phase space technique; it's a handy tool for investigating the properties of solutions in a qualitative way.
Lab Demo ( Project Component )
References
See the page about the single pendulum for more about how pendulums work and the math behind this simulation. This simulation is identical to that one, but adds a graph of the direction field (AKA slope field) of the differential equation. This direction field is shown overlapping the phase space graph of angular velocity vs. angle. At each point, the path of the pendulum in phase space is along the direction field.
Also available are: Full Lab Experiment, For more details refer - here.